A Frail New World
We argue why the long-term outlook for GDP growth and for returns on risk assets is uninspiring. We are often ‘accused’ of allowing the negative long-term demographic outlook to colour our view on risk assets in general, but we argue why the demographic outlook is only one of (at least) four factors, which will hold back GDP growth as well as returns on risk assets in the years to come.
Open this issue (PDF)Preview
I may be surprised. But I don’t think I will be.
A stranger walking in the countryside comes across a shepherd and a huge flock of sheep. He tells the shepherd that he will bet $100 against one of his sheep that he can tell the exact number in the flock. The shepherd thinks it over; “It’s a big flock”, he says to himself, so he takes the bet. “973”, says the stranger. The shepherd is astonished, because that is exactly right. “OK, I'm a man of my word, take an animal”. The stranger picks one up and begins to walk away.
“Wait”, cries the shepherd. “Let me have a chance to get even. Double or nothing that I can guess your exact occupation”. The stranger agrees. “You are an economist for a government think tank”, says the shepherd. “Amazing!” responds the stranger. “You are exactly right. But tell me, how did you deduce that?” “Well”, says the shepherd, “Put down my dog and I will tell you”.
Why economic growth will disappoint for many years to come
Economists are always right, even when they are not, aren’t they? Fat chance. The reality is very different. Writing these letters is akin to being constantly exposed, and – at times – looking rather silly. But I still enjoy it, so allow me to stick my neck out again and go against the consensus, because that is, at the end of the day, how you make money in this industry.
The broad consensus is that DM countries are finally returning to some sort of normality (often called the New Normal), following years of Zombie-like conditions. There is, admittedly, a growing recognition that GDP growth is likely to disappoint for quite a while to come, but I believe that ‘quite a while’ should be measured in decades and not, as most seem to believe, in years.
In the following, I will argue that GDP growth will disappoint for a very long time to come, and that will obviously have an effect on corporate earnings growth as well. As I see things, most investors are still way too optimistic on GDP growth and corporate earnings growth for the next many years. Why is that?
Let me step back for a second. When liaising with our readers, many of them appear to think that a rather bleak demographic outlook is the sole reason why we take such a dim view of the future. Not entirely correct. The demographic outlook is admittedly not great and will almost certainly hold back returns on financial assets in many countries for a long time to come, but that is not the whole story. In this Absolute Return Letter I will attempt to provide a more complete picture.
There are in reality not one but at least four reasons why returns on financial assets will (I have chosen the word ‘will’ rather than ‘are likely to’, as these factors are virtually set in stone) disappoint in the years to come, and they are (in no particular order):
- Regulatory changes
- The end of the debt super-cycle
- Wealth-to-GDP to normalise
- A deteriorating demographic outlook
One could argue that (1) and (2) are two sides of the same
story, and that is partly correct, but only partly. Regulatory changes have
already had, and will continue to have, a significant impact on overall lending
(and hence on GDP growth), but other factors will have an effect as well. More
about this later.
1. Regulatory changes
The problem in a nutshell is that the balance sheets of most banks, after years of rapid growth, have simply grown too big. One important lesson learned from the Global Financial Crisis (‘GFC’) is that financial leverage is good, but only to a point, and regulatory authorities on either side of the Atlantic are now anxious to reduce the size of those loan books.
In more recent times, the financial system has been used quite extensively to prop up the economy, following recessionary conditions. Not only have interest rates fallen profoundly, but financial leverage has risen as well. It did so after the recession in the early 1980s; it happened again following the 1991 recession, and again following the 2001-02 recession (although chart 1 is an illustration of U.S. financial sector leverage, the picture is largely the same in most other DM countries). Only in 2008, when the world was hit by the GFC, did leverage in the financial sector fall sharply (Chart 1).

Source: JP Morgan Asset Management, Federal Reserve, Haver
Regulatory changes underway on both sides of the Atlantic will almost certainly drive financial
sector leverage further down. Not many weeks ago I had lunch with a senior
official of a major European bank. He told me that European banks are under
tremendous pressure to reduce the size of their loan books. Total bank loans in
Europe add up to about €18 trillion, he said. The
equivalent number in the U.S. is apparently ‘only’ $8 trillion, and the two
economies are not a million miles apart size-wise. If the regulatory
authorities succeed with the downsizing of the banking industry, economic
growth will almost certainly be suppressed (using the European Banking
Federation as his source).
U.S. bank lending is also negatively impacted by regulatory constraints, even if it is less visible to the naked eye. Pre-GFC, personal income and credit card debt grew at approximately the same rate in the U.S. and, once the crisis was (largely) over, one would have expected that trend to resume, but it hasn’t (Chart 2). Even if depressed levels of personal income are taken into account, total credit card debt is still some $350 billion short of the trend line. The most likely cause? Regulatory constraints in the banking industry.

Source: JP Morgan Asset Mgmt., BEA, Consumer Financial Protection Bureau, CCDB, Federal Reserve
The anecdote from Europe and the
credit card example from the U.S. basically tell one and the same story – that
regulatory authorities on both sides of the Atlantic are desperate to avoid a
repeat of the GFC, which has caused so much damage.
If that anxiety hasn’t already resulted in a lower GDP growth rate, it certainly will. There is no doubt in my mind that the regulatory changes already implemented are only the beginning of a lot more to come.
2. The end of the debt super-cycle
Some of the more drama-seeking commentators have called QE the biggest money printing experiment in history but, in reality, it is not. What they did in the Weimar Republic or in Zimbabwe was money printing; QE is not. I have been there before, and do not intend to repeat myself; suffice to say that whilst QE is not money printing, it has still had a rather dramatic effect on asset prices (both bonds and equities), and on financial leverage as well.
Having said that, overall leverage began to rise decades ago, long before anyone had ever heard of QE. Debt super-cycles last 50-75 years on average (Source: Ray Dalio, Bridgewater Associates), and one school of thought is that the debt super-cycle we are in now started in the aftermath of World War II, as lots of re-construction was needed. However, if one looks at long-term debt charts, one could also argue that the growth in debt didn’t really take off in a meaningful way until the early 1980s – at about the same time as the start of the great bull market in both bonds and equities (Chart 3).

Source: Fasanara Capital, BofAML
In a debt super-cycle, as the cycle advances, economic growth is increasingly driven by a combination of growth in debt and money (as in money supply). Having said that, there are obviously limits to how much spending growth can be financed by debt and money. When that point is reached, you are at the end of the debt super-cycle. John Maynard Keynes called it Push on a String, when he first described the phenomenon in 1935. Nowadays, it is often called the Liquidity Trap.
What we are now beginning to see are the first signs of Push on a String. When that happens, monetary policy is already so accommodating that further rate cuts will have virtually no effect on economic growth. QE also becomes largely ineffective, as risk premia are too low to drive investors to assume more risk. The very low returns that we currently see across almost all asset classes is a classic sign that we are approaching the end of the debt super-cycle.
Another sign is the no-growth in money supply. The U.S. Fed stopped the third instalment of QE in October 2014; at about the same time, the rapid growth in U.S. money supply stopped and has been moving broadly sideways ever since (Chart 4).

Source: Daily Telegraph article on the end of QE
With private debt having peaked almost everywhere (Chart 5), and without an ever increasing supply of money, it is no wonder that economic growth is finding it difficult to gather momentum, and nor should we be surprised that risk assets are struggling.

Source: The Bank Credit Analyst. January 2016
Whether one can conclude that the end of QE equals the end of the debt super-cycle is another question. Very accommodating monetary authorities have certainly contributed to the growth in lending, but one cannot point fingers at only one guilty party. After all, it isn’t enough that banks are willing to lend. Borrowers must also be willing to borrow.
Wealth-to-GDP to normalise
Not for the first time, I have taken advantage of Woody Brock’s extensive knowledge when writing this letter. (Note: Woody Brock is an economic consultant to Absolute Return Partners.) The following is actually quite theoretical in nature, and I apologise in advance, if I lose one or two readers over the next few paragraphs, but here we go.
An advance in econometrics in recent years has led to findings that weren’t previously possible. One such finding is that certain ratios – e.g. wealth-to-GDP – have well defined long-term mean values. The mean value for U.S. wealth–to-GDP is 3.7. (The same approach can be applied to P/E ratios, and the mean value for the U.S. P/E ratio is approx. 15.) The ratio is no less than 4.75 at present, implying that wealth is going to drop significantly at some point in the future (or, at the very least, grow much more slowly than GDP for an extended period of time).
It ought to be said that a drop in wealth-to-GDP from 4.75 to 3.7 would in all likelihood result in vast losses of wealth. The last time the Americans experienced a significant and sustained loss of wealth was during the 1966-81 period, where wealth fell by over 3% per year.
Then, in the early 1980s, the great bull market took over, which resulted in almost incomprehensible gains in wealth. Total U.S. wealth, as defined by the Federal Reserve, went from $11.5 trillion in 1981 to $85 trillion in 2015, leading to a wealth-to-GDP ratio of 4.75. It is a large part of this increase in wealth that would have to be given up again, if the ratio goes back to its long-term mean value.
(Note: I have only referred to U.S. numbers here, as I don’t have access to corresponding numbers from anywhere else, but they are not likely to be vastly different in most other countries, given that the great bull market has been almost global in nature.)
In order to understand the logic behind it all, think of wealth as capital and GDP as output. The wealth-to-GDP ratio is therefore the capital-to-output ratio, and a ratio of 3.7 implies that it takes $3.7 of capital to produce $1 of output. Hence, the ratio is effectively a capital efficiency ratio, and the lower the ratio is, the more efficiently a country utilizes the capital at its disposal. I note that the U.S. enjoys one of the lowest mean values in the world. Here in Europe, the long-term mean value of wealth-to-GDP is 4.7 by comparison.
Now to the tricky part. Why is the ratio stable – at least in the long run? The reasons lie deep within growth theory, which few investors will ever have heard of and even fewer will understand (me included). If the nature of the production function is Cobb-Douglas in mathematical terms, then the capital-to-output ratio – and hence the wealth-to-GDP ratio – must be long-term stable; and it is.
(Note: A Cobb–Douglas function is a production function that is typically used to represent the relationship between the amounts of inputs (particularly capital and labour) and the amount of output that can be produced by those inputs.)
There is another way to think of this. If the amount of capital relative to output is very high (as it is at present), then the return on that capital will be reduced by competition, and people will save less. This will lower the amount of capital over time and will thus lower the capital-to-output ratio.
The obvious next question to ask is when will the ratio mean-revert? There is not much point in knowing that wealth-to-GDP will drop at some point, if it won’t happen in our lifetime. This is, however, not so simple; there is no mathematical solution to that question. That said, if one understands the circumstances that have driven the wealth-to-GDP ratio to 4.75, one can arrive at some conclusions.
The easy one first. When you plot the ratio over the last 100 years, no single set of data explain much of the variations in the value of the wealth-to-GDP ratio. In other words, no single factor can explain why wealth-to-GDP is so high at present. In many ways, it would be much simpler if the extraordinarily low interest rates that we enjoy at the moment could explain all the variation, but that is not the case. A combination of factors appear to be at work.
Back in December, I wrote an Absolute Return Letter named The Next Driver of Productivity. In the letter, I argued that automation will intensify in the years to come, and that many jobs will be lost as a result. Automation requires capital, of which there is plenty at the moment, and at a very affordable price. As significant amounts of capital is ploughed into automation, the capital-to-output ratio (and hence the wealth-to-GDP ratio) will fall, or so I think.
One last thought. When I first tuned into this topic, I thought wealth-to-GDP was high mainly as a result of low interest rates, but could it be the other way round? Could it be that interest rates are not (only) low because of QE, but (also) because the world is awash in capital? It certainly looks like it, even if almost the entire world tend to think that QE is to blame.
A deteriorating demographic outlook
The final reason why I think both GDP and asset prices will undershoot most expectations in the years to come is the worsening demographic outlook, which I have written quite extensively about in recent months, so allow me to skate over this topic fairly quickly.
Remember what I said a few months ago. At the most basic level, only two factors drive GDP growth, and that is workforce growth and productivity growth. Productivity changes can be quite difficult to predict, but workforce growth is straightforward. With a high degree of accuracy, we can forecast what is going to happen to the workforce for many years to come, and it is not a pretty picture (Chart 6).

Source: Goldman Sachs Investment Management, United Nations
Of all the major nations around the world, only the U.S. will experience actual growth in the workforce, and it will be very modest. In Japan, which will be hit the hardest (together with South Korea and China), the fall in the workforce translates into approximately -1% in annual rGDP terms. In other words, only if productivity grows by more than 1%, will Japan see any growth in GDP.
The fall in Europe’s workforce will impact European GDP growth by approximately -0.5% per year, and here in the UK, where the impact is modest compared to most other countries, the impact will only be marginally negative.
So the question begs: How much can productivity grow, and could it offset the impact from a fall in the workforce? The two fastest growing periods post World War II was (i) the mid-1950s to the mid-1960s, and (ii) the mid-1990s to the mid-2000s. The first was driven by the infrastructure revolution (better roads, private cars for everyone and an emerging airline industry), whilst the second is now known as the dot com boom.
Despite the significant impact those inventions had, overall productivity didn’t rise by more than 2-2½ % per annum (Chart 7). I am therefore very comfortable with my prediction that productivity enhancements will not fully offset the lower GDP growth to be expected from a fall in the workforce. GDP growth can only disappoint for many years to come.
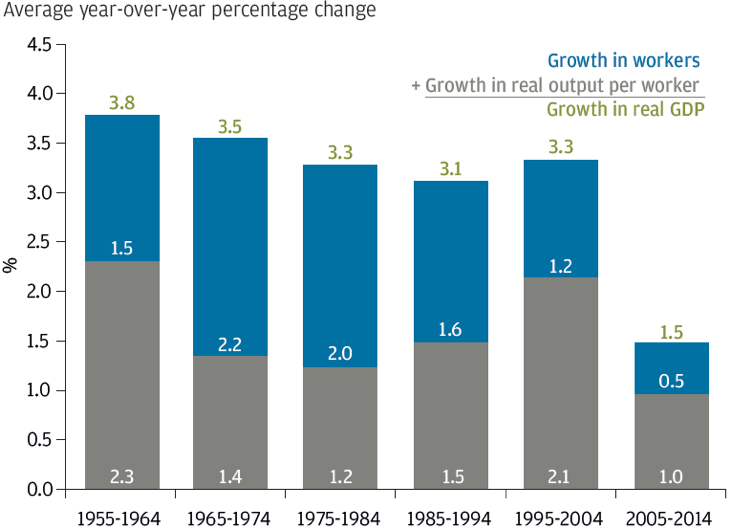
Source: JP Morgan Asset Management. Data of 21 August 2015.
Where could I possibly go wrong?
Regrettably, I am not like the economist in my little opening story. I do occasionally get things wrong, even if it is rare (hmm). If I get this one wrong, it could happen in a number of areas.
As far as demographics are concerned, DM countries could decide to open the gates and let in millions of migrants. Not very likely to happen if you ask me, but it could. Secondly, the trend towards increased automation could possibly raise productivity to levels we have never experienced before. I don’t think it would ever fully offset the loss of GDP from a fall in the workforce, but it could mute the effect.
Could wealth-to-GDP stay high forever? We already know that there are dramatic technology shocks in the pipeline over the next several years. I discussed that in December. We also know that the amount of capital needed per unit of GDP is rising with an increase in automation. Could you possibly deduce from that, that the capital-to-output ratio will stay at elevated levels forever as a result?
For that to happen, the production function of our economy would have to change. Paul Jones at Stanford University has shown that, over the very long term, the production function is indeed Cobb-Douglas in nature and will not change. I can therefore confidently say that timing is all I could be wrong on, as far as normalisation of the wealth-to-GDP ratio is concerned.
The debt super-cycle next. The private sector debt super-cycle has almost certainly come to an end. The scars from 2008 are still horrific and have fundamentally changed the attitude towards leverage – both amongst borrowers and lenders.
Having said that, the private sector is only half the story (see Chart 5 again). Governments all over the world continue to grow debt and, whilst such a strategy will only work as long as interest rates remain very low, the case of Japan has demonstrated to the rest of the world that public debt can be almost unimaginably high.
Finally, as far as regulatory changes are concerned, the more GDP slows as a result of a falling workforce, the more lightly regulatory authorities are likely to regulate the banking industry. It is, after all, in nobody’s interest that there is no GDP growth at all.
Conclusion
It should now be obvious that one or two things could indeed be done to address the challenge(s) we are facing. That said, should the regulatory authorities for example decide to go relatively easy on our banks, there are still plenty of other structural trends that will happen regardless, which between them will hold back GDP growth – and returns on risk assets.
Bond yields are likely to stay comparatively low for much longer than many expect, partly because inflation is likely to remain subdued, as it almost always is when GDP growth is low, and partly because policy rates will be kept relatively low in order to stimulate economic growth. Having said that, policy rates will, a few years from now, likely be meaningfully higher in the U.S. than in Europe.
Equities are likely to deliver very modest returns, at least when compared to the returns we have enjoyed since the early 1980s. If GDP only grows between 0% and 1.5% per annum as we expect, and risk-free rates of return stay near current levels, assuming the equity risk premium doesn’t meaningfully change, mid-single digit annual returns are the best we can hope for going forward. Those estimates are obviously average numbers, and actual equity returns could vary substantially from those averages from one year to the next.
Commodity returns may behave a little differently. At first glance, low GDP growth is obviously not conducive to high commodity returns, but China has had a profound effect on many commodity prices since the Chinese rout started last year; hence the commodity story is quite different from the equity story, but more about that next month.
Investment Megatrends
Our investment philosophy, and everything we do at ARP, is driven by the long-term Investment Megatrends which are identified and routinely debated by our investment team.
Related Investment Megatrends
Our investment philosophy, and everything we do at ARP, is driven by the long-term Investment Megatrends which are identified and routinely debated by our investment team. Read more about related Megatrend/s for this article:
About the Author